
ERA5-LAND • 10 KM • 1950 TO NEAR REAL TIME
Global climate intelligence at your fingertips.
High-resolution climate indicators based on ERA5-Land reanalysis, covering global land areas at 10 km resolution. Designed for researchers, policymakers, and developers — accessible via web viewer and RESTful API.
Launch Map ExplorerEverything you need to
explore global climate
data
Global coverage, high resolution
Global land-masked coverage at 10 km resolution with daily, monthly, and yearly data aggregation. Access climate indicators via OGC-standard services (WMS, WCS) through a web viewer or RESTful API — with custom time aggregations available on request.
Temperature, precipitation, heatwaves & more
Temperature (Mean, Min, Max, Summer Days, Tropical Nights, Tx99p)
• Precipitation (Dry Days, Wet Days, Rx5Day, R95p)
• Heatwaves (Frequency & Duration)
• Humidity (Relative Humidity, Dewpoint Temperature)
All derived from ERA5-Land reanalysis.
From ERA5-Land to actionable insight
ClimateHub ingests ERA5-Land data and computes standardized climate indicators, made available as visual layers and downloadable datasets. Real-time monitoring, historical analysis, and custom aggregation workflows — all accessible through standard GIS tools or direct API calls.
Climate data for every sector
From agricultural risk assessment to urban heat monitoring — ClimateHub delivers the indicators that climate-sensitive sectors need.

Agriculture & Food Security
Drought · Rainfall · Growing seasons
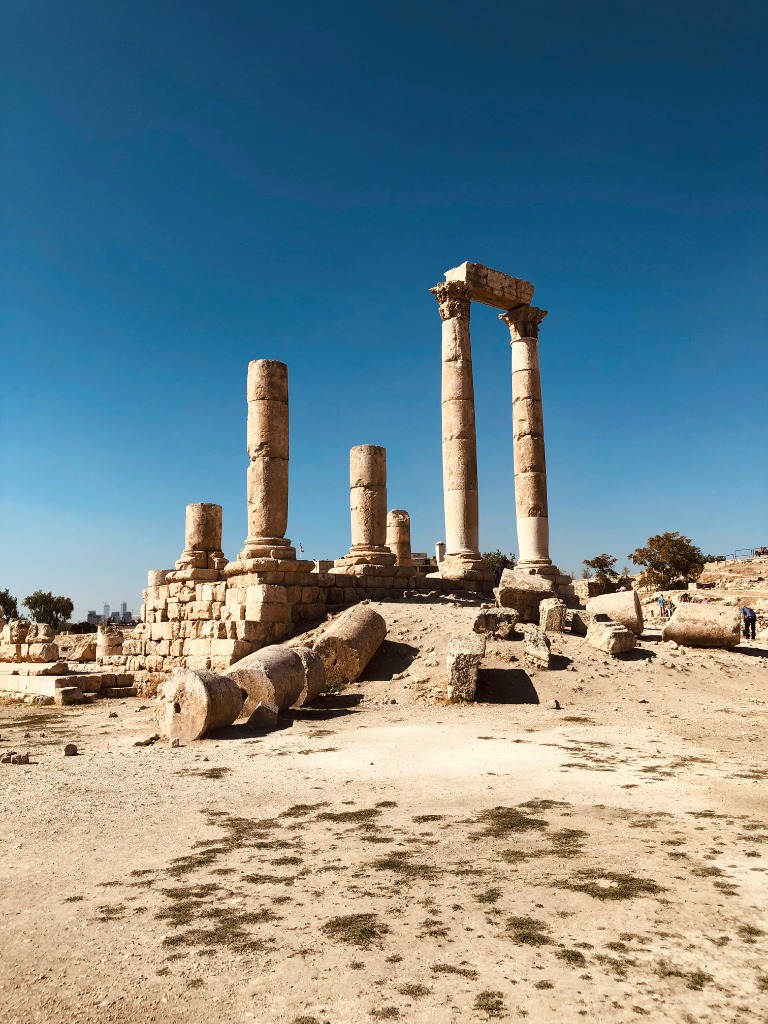
Cultural & Natural Heritage
Humidity · Temperature extremes

Energy Sector
Wind · Solar · Demand forecasting
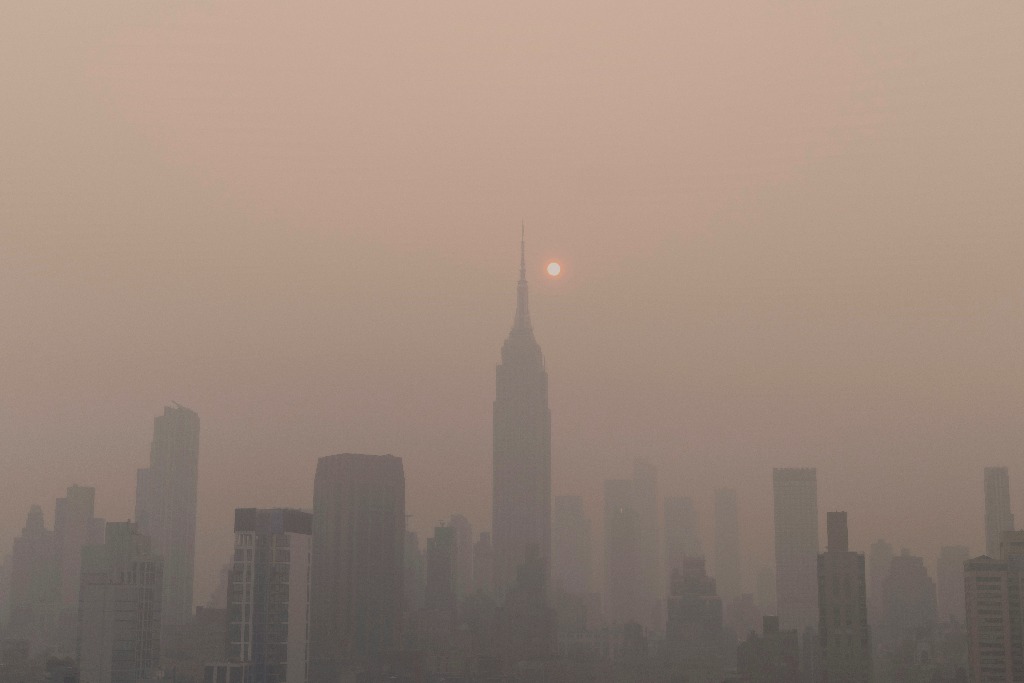
Urban Planning & Health
Heatwaves · Air quality · Resilience
Two ways to access the data
Whether you prefer a visual interface or programmatic access, ClimateHub has you covered.
Web Viewer
Explore climate indicators through an interactive map without writing a single line of code. Toggle layers, animate time series, adjust transparency, and download snapshots.
- Interactive map with layer controls
- Temporal animation & timebar
- Colour tuning & transparency
- Spatial query & aggregation tools
RESTful API
Integrate climate indicators directly into your workflows, models, and applications. OGC-compliant services (WMS, WCS) make it straightforward to plug into existing GIS tools.
- OGC-standard WMS & WCS endpoints
- Raster & time series retrieval
- Custom time aggregations on request
- Compatible with QGIS, ArcGIS & more
Ready to explore global climate intelligence?
Access climate indicators for researchers, policymakers, and developers.